pnw_seismic_event_detection
QuakeXNet · Mt. Rainier Surface Event Catalog (2010–2025)
End-to-end pipeline for building a 15-year catalog of surface seismic events near Mt. Rainier. The workflow runs the QuakeXNet deep-learning detector on continuous waveforms from stations within 50 km of the volcano, aggregates detections across the network, locates them with ENVELOC, and validates the results against the PNSN and ESEC catalogs.
| Surface events (SU) | 114,775 |
| Explosions (PX) | 13,766 |
| Total located | 128,541 |
| Period | Jan 2010 – Dec 2025 |
Catalog Overview
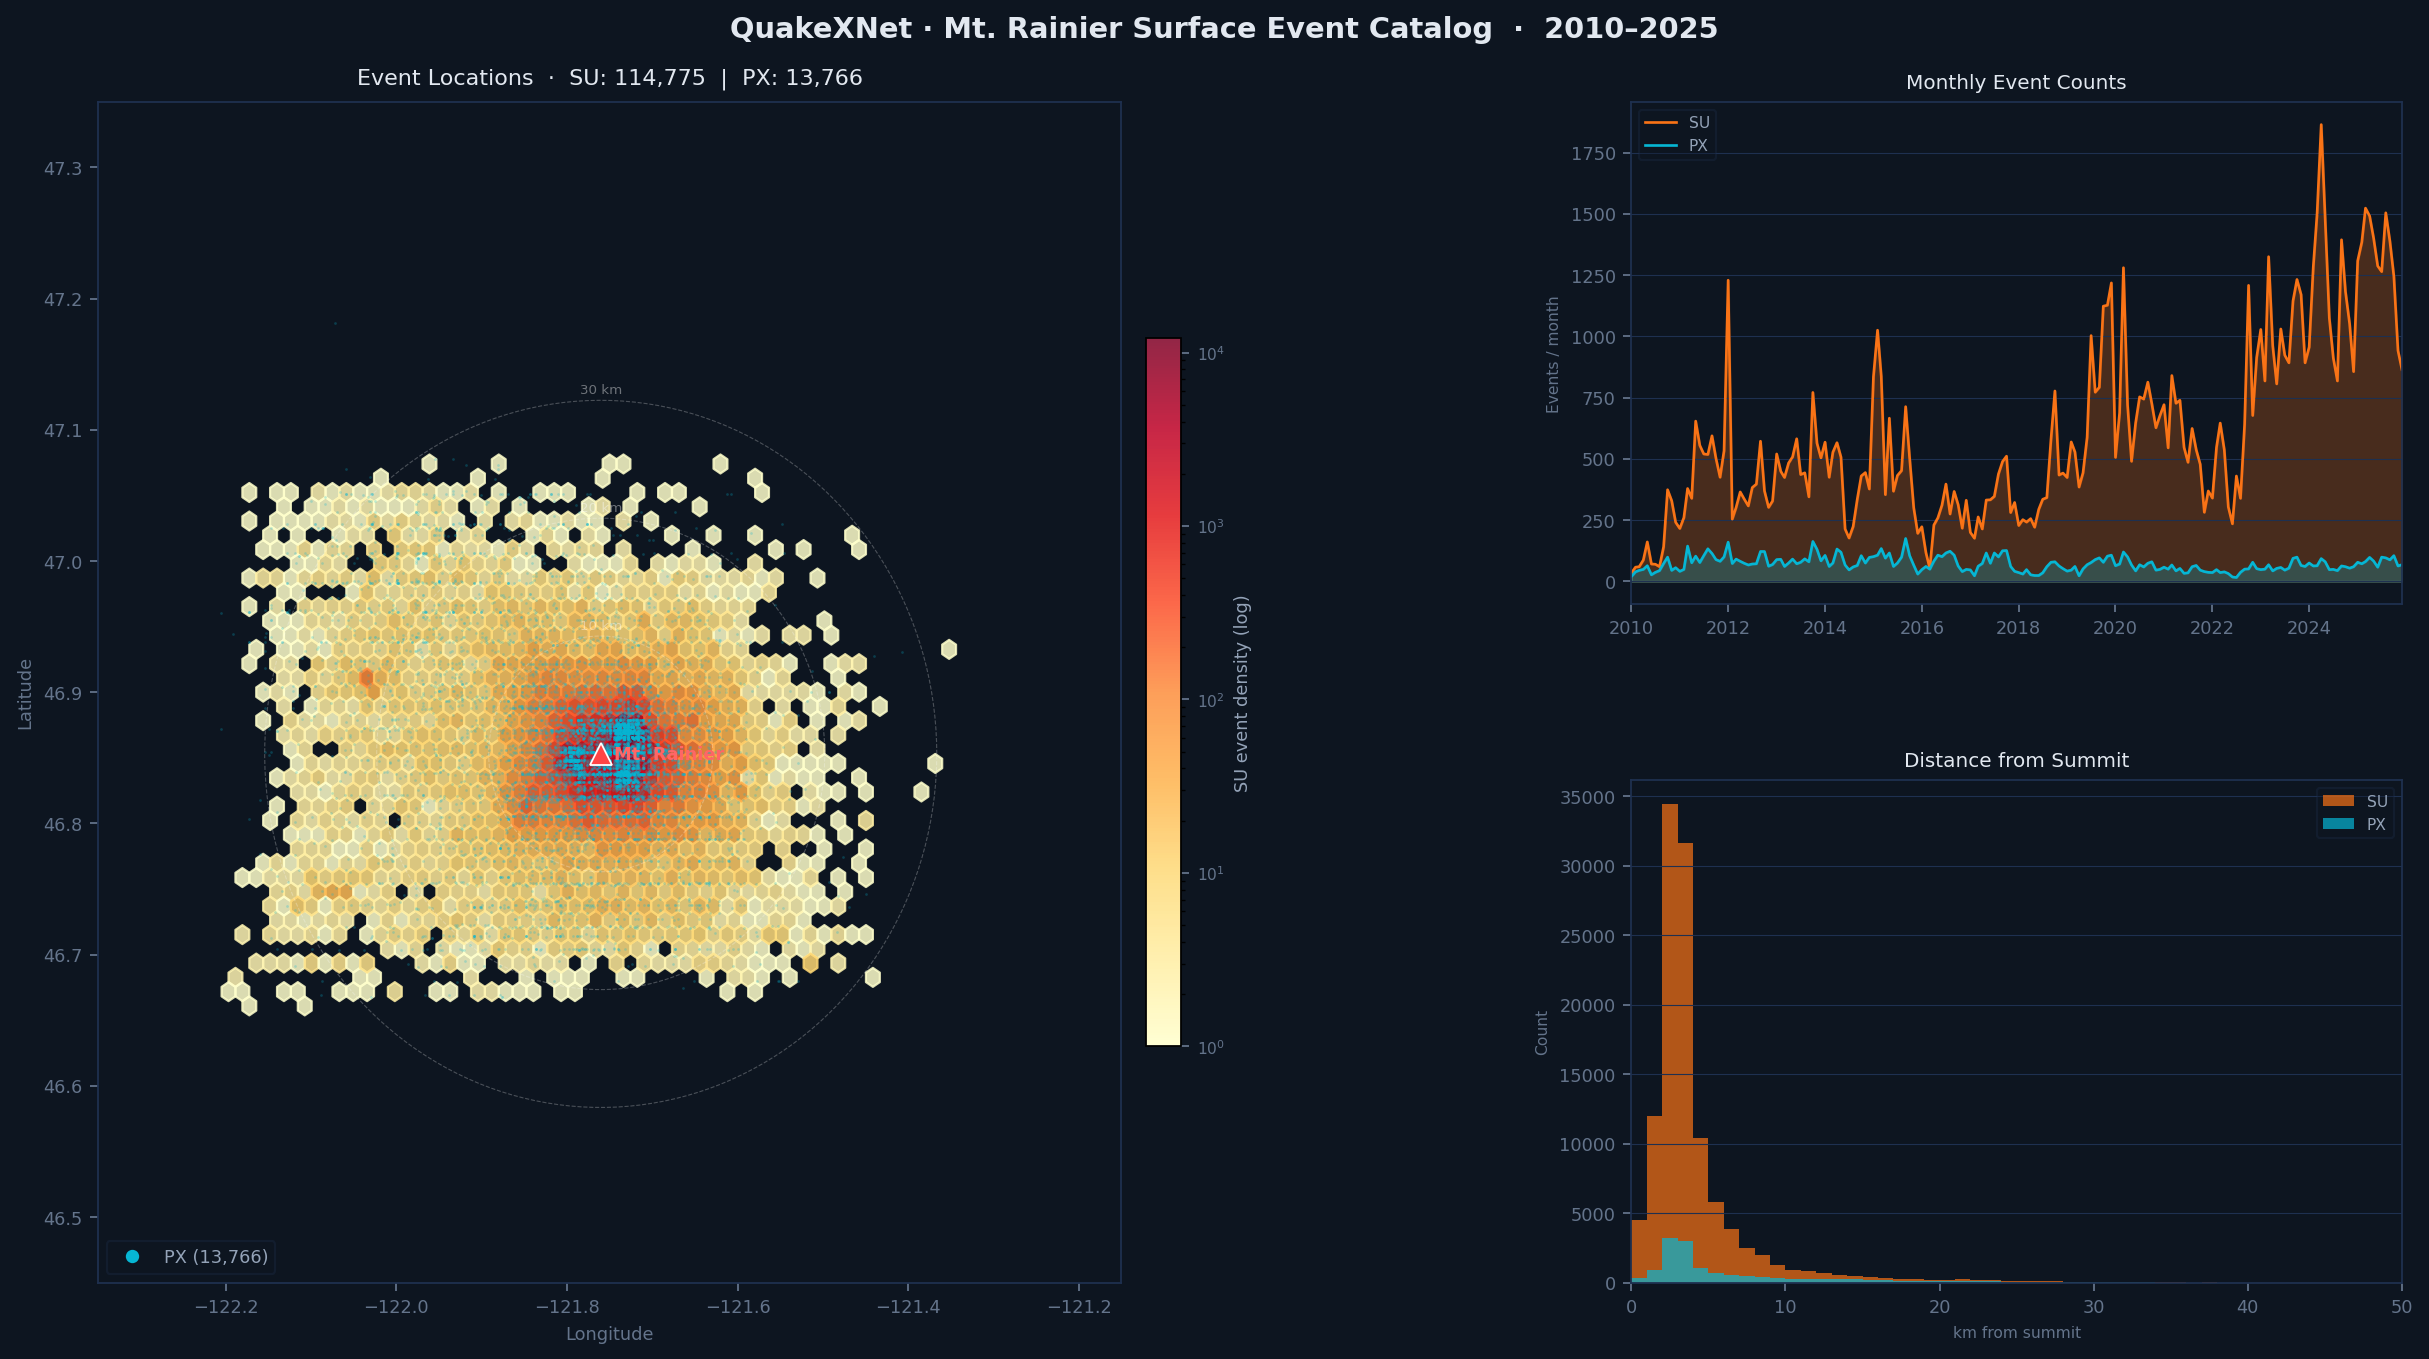
Interactive dashboard – explore the full catalog at akashkharita.github.io/pnw_seismic_event_detection/data/enveloc_dashboard.html: heatmap / point-cloud toggle, time-series, distance histogram, and per-class / per-station-count filters.
Repository Structure
src/          Detection and location scripts
notebooks/    Analysis, validation, and exploration notebooks
data/         Catalog outputs and dashboard
utils/        Station metadata
Notebooks
Detection & Pipeline
| Notebook | What it shows |
|---|---|
plotting_commonly_detected_events.ipynb |
Gathers per-station daily detections, finds events seen at ≥ 4 stations, and plots waveforms + probability curves for network-level events |
walking_through_generate_common_events.ipynb |
Step-by-step walkthrough of the common-event aggregation logic (time-alignment, grouping, station-count filtering) |
creating_station_json_file_for_the_detector.ipynb |
Builds the stations.json configuration used by the detector |
Location
| Notebook | What it shows |
|---|---|
enveloc_location_for_detected_events.ipynb |
Runs ENVELOC on network-level detections; benchmarks sequential vs. parallel waveform downloading |
combining_all_the_locations_into_single_file.ipynb |
Merges per-day ENVELOC outputs into the master catalog CSV |
testing_location_using_enveloc.ipynb |
Tests and tunes ENVELOC hyperparameters on a subset of events |
Catalog Validation & Diagnostics
| Notebook | What it shows |
|---|---|
quakexnet_diagnostic.ipynb |
Comprehensive diagnostic: PNSN recall analysis, missed-event classification (confused / ambiguous / missed), single-event trace-through, co-association check, and V1 vs V3 catalog comparison |
comparing_with_pnsn_catalog.ipynb |
Matches QuakeXNet detections to the PNSN catalog by distance and time tolerance; computes precision/recall |
validating_enveloc_locations_for_esec_events.ipynb |
Cross-checks located events against the ESEC documented surface-event catalog (quality score 1–5) |
analyzing_quakexnet_15_years_detection_results.ipynb |
Bulk analysis of the full 15-year detection run: class distributions, temporal trends, and PNSN comparison |
Surface Event Characterization
| Notebook | What it shows |
|---|---|
su_clustering_new_new.ipynb |
Clusters surface events by source type using 128-dim QuakeXNet embeddings (best-window extraction → UMAP → HDBSCAN), with spectrogram visualization per cluster |
single_event_analysis.ipynb |
Deep-dive on a single icefall event: compares STA/LTA, deep-learning, and kurtosis pickers, motivating the need for ENVELOC |
single_event_infrasound_analysis.ipynb |
Infrasound analysis for individual surface events |
visualizing_infrasound_data_for_mt_rainier_surface_events.ipynb |
Surveys infrasound signatures across the catalog to identify event types with strong infrasound expression |
plotting_the_infrasound_location_with_original_one.ipynb |
Compares ENVELOC seismic locations against infrasound-derived locations |
Model Diagnostics
| Notebook | What it shows |
|---|---|
quakexnet_diagnostic.ipynb |
(see Validation above) |
testing_surface_event_pickers.ipynb |
Benchmarks different onset-picking strategies on surface event waveforms |
Using the trained QuakeXNet model
The trained weights (src/models/quakexnet/base.pt.v3) and the model definition
(src/quakexnet.py) both live in this repo, so no download or SeisBench
patching is required. SeisBench itself is still needed — QuakeXNet subclasses
seisbench.models.base.WaveformModel and inherits annotate() from it.
Quick start (recommended)
from load_model import load_quakexnet   # run from the src/ directory

model = load_quakexnet()
probs = model.annotate(stream, stride=500)   # stream = 3-component ObsPy Stream
annotate() returns four traces — QuakeXNet_eq, QuakeXNet_px,
QuakeXNet_no, QuakeXNet_su. px is the explosion class; no is noise and is
ignored by the detection scripts. Resampling to the model’s 50 Hz is handled by
SeisBench.
Alternative: register the model inside SeisBench
Needed only if you want sbm.QuakeXNet.from_pretrained(...) to work, e.g. to
share the model across projects.
-
Copy the model definition into the SeisBench package:
cp src/quakexnet.py "$(python -c 'import seisbench, os; print(os.path.join(os.path.dirname(seisbench.__file__), "models"))')/quakexnet.py" -
Add to
seisbench/models/__init__.py:from .quakexnet import QuakeXNet -
Copy the weights into the SeisBench cache. Note that the cache root is not always
~/.seisbench— it can be overridden bySEISBENCH_CACHE_ROOT:CACHE=$(python -c 'import seisbench; print(seisbench.cache_root)') mkdir -p "$CACHE/models/v3/quakexnet" cp src/models/quakexnet/base.pt.v3 "$CACHE/models/v3/quakexnet/base.pt.v3" echo '{}' > "$CACHE/models/v3/quakexnet/base.json.v3" -
Then:
import seisbench.models as sbm
model = sbm.QuakeXNet.from_pretrained("base", version_str="3")
Detection Pipeline
src/custom_daily_detection.py
Runs QuakeXNet on continuous waveform data for each station and logs per-station event detections.
Workflow:
- Loads the pre-trained QuakeXNet model and station list from
stations.json - Downloads waveform data from IRIS via ObsPy for each station
- Runs model inference with a 100 s window and 10 s stride, producing per-window probabilities for
eq,px, andsu - Smooths probability curves with a 5-sample moving average (~50 s)
- Detects events: start ≥ 0.15, end < 0.15, kept only if max probability ≥ 0.5
Output — one CSV per station:
| station | network | class | auc | mean_prob | max_prob | start_time | end_time |
|---|---|---|---|---|---|---|---|
| PARA | CC | eq | 3.37 | 0.35 | 0.54 | 2025-12-13T14:44:22Z | 2025-12-13T14:45:52Z |
src/custom_generate_common_events.py
Aggregates per-station detections into network-level common events.
Workflow:
- Merges all per-station CSVs for the chosen date range
- Rounds start times to the nearest 10 s to align slightly offset detections
- Groups by rounded start time; computes
num_stations,most_common_class,mean_auc/max/prob - Keeps only events detected at ≥ 4 stations (default)
Output — one CSV per day:
| rounded_start | num_stations | stations | most_common_class | mean_auc |
|---|---|---|---|---|
| 2025-08-03 20:03:30+00:00 | 4 | [‘RCM’, ‘RER’, ‘STAR’, ‘OBSR’] | su | 4.72 |